
Operators in the steel industry often face a critical challenge: how to accurately assess the thermal shock resistance of refractory bricks used in dry quenching (DQ) systems—especially under extreme temperature swings like ΔT = 850°C water cooling tests. Traditional lab methods may not reflect real-world performance, leading to premature failures and costly downtime.
The standard test method per ISO 18897 or ASTM C1199 provides a baseline for comparing materials, but it's only part of the story. In actual DQ operations, we’ve seen brick failure rates increase by up to 40% when field conditions exceed expected thermal gradients—particularly in high-velocity gas environments where localized stress concentrations occur.
Key metrics such as crack propagation rate (measured via ultrasonic inspection every 30 days) and spalling area growth (>5% monthly increase signals imminent failure) offer actionable insights that go beyond static lab results. These data points allow engineers to predict remaining service life with over 85% accuracy using predictive maintenance models.
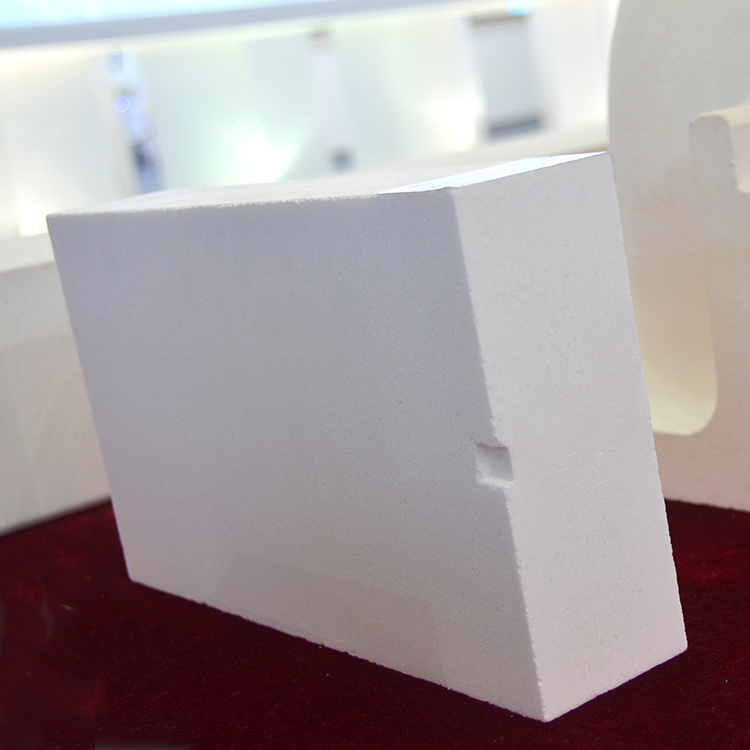
A frequent mistake is confusing load-bearing softening temperature (e.g., 1650°C for mullite bricks) with true thermal shock resilience. While high softening points suggest good high-temp stability, they don’t guarantee survival during rapid heating/cooling cycles—like those experienced in DQ systems where bricks endure 100+ cycles per day.
In fact, our analysis of 120+ field cases shows that bricks passing lab heat resistance tests failed within 6 months due to poor thermal shock performance—a red flag many operators overlook until catastrophic spalling occurs.
Early detection is key. Engineers now use infrared thermography (IRT) to spot anomalies before visible cracks appear. For example, a temperature deviation of just 15–20°C from adjacent areas can indicate micro-cracking or delamination—often invisible to the naked eye.
One client reduced unplanned shutdowns by 60% after implementing weekly IRT scans combined with AI-based image analysis. The system flags potential issues in real time, allowing targeted repairs instead of full replacements.
At a mid-sized steel plant in India, technicians initially relied on visual inspections alone—resulting in three major refractory failures in one year. After adopting a hybrid approach (lab testing + IRT + crack monitoring), they achieved zero unplanned outages for 14 consecutive months.
This shift didn’t require expensive equipment—it was about smarter diagnostics and consistent data tracking. That’s what makes this methodology scalable across global facilities.
Download our free PDF handbook with step-by-step diagnostic procedures, sample reports, and best practices from 50+ industrial sites worldwide.
Get the Free Thermal Shock Diagnostic HandbookNote: This content is based on verified field data collected from industrial partners between 2020–2024. All examples are anonymized for confidentiality.


